·

MIT licence

Three lines in Anthropic's clay and olive palette: project, git branch and lines changed; model with a braille context bar and session time; then five-hour and seven-day usage with reset countdowns. Needs a Nerd Font. No network calls; overwrites ~/.claude/cache/rate-limits.json on each render, and inside tmux reads its status settings with tmux show.

0 copies

In Claude Desktop? Add this status line with statusline-anywhere.

Preview

Clean repo
󰉋 app (main) +128 -34 Opus 4.8 ⣿⣿⣿⣿⣀⣀⣀⣀⣀⣀⣀⣀⣀⣀⣀⣀⣀⣀⣀⣀ 22% · 󰥔 10m 5h 26% 󰑐 2h06 · 7d 7% 󰑐 2d 0h
New session
󰉋 app (main) +0 -0 Opus 4.8 ⣀⣀⣀⣀⣀⣀⣀⣀⣀⣀⣀⣀⣀⣀⣀⣀⣀⣀⣀⣀ 0% · 󰥔 10m —
Dirty branch
󰉋 app (feat/auth) +128 -34 Sonnet 4.6 ⣿⣿⣿⣿⣿⣿⣿⣿⣿⣀⣀⣀⣀⣀⣀⣀⣀⣀⣀⣀ 48% · 󰥔 10m 5h 40% 󰑐 1h11 · 7d 18% 󰑐 2d 21h
Near-full
󰉋 app (main) +128 -34 Opus 4.8 ⣿⣿⣿⣿⣿⣿⣿⣿⣿⣿⣿⣿⣿⣿⣿⣿⣿⣿⣀⣀ 91% · 󰥔 10m 5h 88% 󰑐 0h17 · 7d 61% 󰑐 19h59
1M context
󰉋 app (main) +128 -34 Fable 5 ⣿⣿⣿⣿⣿⣿⣿⣿⣿⣿⣿⣿⣀⣀⣀⣀⣀⣀⣀⣀ 64% · 󰥔 10m 5h 33% 󰑐 3h29 · 7d 80% 󰑐 4d 23h
Post-compact
󰉋 app (main) +128 -34 Haiku 4.5 ⣀⣀⣀⣀⣀⣀⣀⣀⣀⣀⣀⣀⣀⣀⣀⣀⣀⣀⣀⣀ 0% · 󰥔 10m 5h 52% 󰑐 4h01
Worktree
󰉋 feature (feature/worktree-feature) +128 -34 Opus 4.8 ⣿⣿⣿⣿⣿⣿⣿⣀⣀⣀⣀⣀⣀⣀⣀⣀⣀⣀⣀⣀ 37% · 󰥔 10m 5h 44% 󰑐 2h49 · 7d 20% 󰑐 1d 6h
Non-git
󰉋 scratch +128 -34 Opus 4.8 ⣿⣿⣿⣿⣀⣀⣀⣀⣀⣀⣀⣀⣀⣀⣀⣀⣀⣀⣀⣀ 22% · 󰥔 10m —

What it does

Three lines: project, git branch and lines changed; the model with a braille context bar and session time; then five-hour and seven-day usage with time until reset.

Written in
Bash
Network access
None
Works in
Terminal

How it works

  1. Reads the folder, model, line counts, context and rate limits from stdin with jq.
  2. Takes the branch from git branch --show-current, or the worktree name and its branch.
  3. Fills a 20-cell braille bar that turns yellow above 30% context and red above 60%.
  4. Usage goes yellow above 50% and red above 80%. Without rate limits, a dim dash shows.

Good to know

  • Needs a Nerd Font for the folder, clock and reset icons, and calls jq and git.
  • Overwrites ~/.claude/cache/rate-limits.json on each render with rate limits, and leaves it there.
  • Inside tmux it runs tmux show -g and hides the usage line if tmux-vitals already shows it.

Source

#!/usr/bin/env bash

# Claude Code statusLine script: renders project/git context, model/context-window
# usage, session duration, and rate limits.
# https://github.com/k8adev/claude-code-statusline

input=$(cat)

# Project & workspace
DIR=$(echo "$input" | jq -r '.workspace.current_dir')
PROJECT="${DIR##*/}"

# Worktree / Branch
WORKTREE=$(echo "$input" | jq -r '.worktree.name // empty')
if [ -n "$WORKTREE" ]; then
  BRANCH=$(echo "$input" | jq -r '.worktree.branch // empty')
  GIT_INFO="${WORKTREE}/${BRANCH}"
else
  GIT_INFO=$(git -C "$DIR" branch --show-current 2>/dev/null)
fi

# LOC (lines added/removed this session)
ADDED=$(echo "$input" | jq -r '.cost.total_lines_added // 0')
REMOVED=$(echo "$input" | jq -r '.cost.total_lines_removed // 0')

# Model
MODEL=$(echo "$input" | jq -r '.model.display_name')

# Context window
PCT=$(echo "$input" | jq -r '.context_window.used_percentage // 0' | cut -d. -f1)

# Rate limits
FIVE_HR=$(echo "$input" | jq -r '.rate_limits.five_hour.used_percentage // empty' | cut -d. -f1)
SEVEN_DAY=$(echo "$input" | jq -r '.rate_limits.seven_day.used_percentage // empty' | cut -d. -f1)
FIVE_HR_RESET=$(echo "$input" | jq -r '.rate_limits.five_hour.resets_at // empty' | cut -d. -f1)
SEVEN_DAY_RESET=$(echo "$input" | jq -r '.rate_limits.seven_day.resets_at // empty' | cut -d. -f1)

# Persist rate limits so tmux (ai-limits.sh) can show them outside this session
RL_CACHE="${CLAUDE_STATUSLINE_RL_CACHE:-$HOME/.claude/cache/rate-limits.json}"
if [ -n "$FIVE_HR$SEVEN_DAY" ]; then
  mkdir -p "$(dirname "$RL_CACHE")"
  echo "$input" | jq -c --argjson ts "$(date +%s)" '{ts:$ts, five_hour:.rate_limits.five_hour, seven_day:.rate_limits.seven_day}' > "$RL_CACHE.tmp" 2>/dev/null && mv "$RL_CACHE.tmp" "$RL_CACHE"
fi

# Duration
DURATION_MS=$(echo "$input" | jq -r '.cost.total_duration_ms // 0')
HOURS=$((DURATION_MS / 3600000))
MINS=$(((DURATION_MS % 3600000) / 60000))
SECS=$(((DURATION_MS % 60000) / 1000))

# Colors — Anthropic brand palette (Clay / Kraft / Sky / Olive / Fig / Deep)
rgb() { printf '\033[38;2;%d;%d;%dm' "0x${1:0:2}" "0x${1:2:2}" "0x${1:4:2}"; }
ACCENT=$(rgb D97757)        # Clay — project name
FG=$(rgb B0AEA5)            # text secondary
COMMENT=$(rgb 5E5D59)       # text muted — separators
GREEN=$(rgb 788C5D)         # Olive
YELLOW=$(rgb D4A27F)        # Kraft
RED=$(rgb C6613F)           # Deep
MAGENTA=$(rgb C46686)       # Fig
DIM='\033[2m'
RESET='\033[0m'
GRAY="$FG"; TERRA="$YELLOW"; TERRA_LIGHT="$ACCENT"

# Icons — Nerd Font Material glyphs, each overridable via CLAUDE_STATUSLINE_ICON_*
# (mirrors tmux-vitals' @vitals_icon_* option pattern).
ICON_DIR="${CLAUDE_STATUSLINE_ICON_DIR:-󰉋}"
ICON_CLOCK="${CLAUDE_STATUSLINE_ICON_CLOCK:-󰥔}"
ICON_RESET="${CLAUDE_STATUSLINE_ICON_RESET:-󰑐}"

# Usage-limit thresholds: green up to LIMIT_WARN, yellow above it, red above LIMIT_CRIT
# (50-30-20 split by default; tmux-vitals uses 60/85 via @vitals_warn/@vitals_crit).
LIMIT_WARN="${CLAUDE_STATUSLINE_LIMIT_WARN:-50}"
LIMIT_CRIT="${CLAUDE_STATUSLINE_LIMIT_CRIT:-80}"
# Context-window thresholds: earlier than the limits — Anthropic's own guidance is that
# performance degrades as the window fills, and used_percentage counts input tokens only.
CTX_WARN="${CLAUDE_STATUSLINE_CTX_WARN:-30}"
CTX_CRIT="${CLAUDE_STATUSLINE_CTX_CRIT:-60}"

# level_color <percent> -> GREEN/YELLOW/RED
level_color() {
  local percent="${1:-0}"
  if ((percent > LIMIT_CRIT)); then
    echo "$RED"
  elif ((percent > LIMIT_WARN)); then
    echo "$YELLOW"
  else
    echo "$GREEN"
  fi
}

# until_epoch <epoch> -> "4d 3h" | "4h26" (mirrors tmux-vitals' scripts/vitals.sh until_epoch)
until_epoch() {
  local target="$1" now secs
  now=$(date +%s)
  secs=$((target - now))
  ((secs < 0)) && secs=0
  if ((secs >= 86400)); then
    printf "%dd %dh" $((secs / 86400)) $((secs % 86400 / 3600))
  else
    printf "%dh%02d" $((secs / 3600)) $((secs % 3600 / 60))
  fi
}

# Context color: green up to CTX_WARN, yellow above it, red above CTX_CRIT
if [ "$PCT" -gt "$CTX_CRIT" ]; then CTX_COLOR="$RED"
elif [ "$PCT" -gt "$CTX_WARN" ]; then CTX_COLOR="$YELLOW"
else CTX_COLOR="$GREEN"; fi

# Context bar (braille: filled ⣿, dotted baseline ⣀ for the rest — same look as the tmux theme)
FILLED=$((PCT / 5))
EMPTY=$((20 - FILLED))
BAR="${CTX_COLOR}$(printf "%${FILLED}s" | sed 's/ /⣿/g')${DIM}$(printf "%${EMPTY}s" | sed 's/ /⣀/g')${RESET}"

# Duration format
if [ "$HOURS" -gt 0 ]; then
  DURATION="${HOURS}h${MINS}"
else
  DURATION="${MINS}m"
fi

# Line 1: [icon] [project] ([branch]) [LOC]
LINE1="${GRAY}${ICON_DIR}${RESET} ${TERRA_LIGHT}${PROJECT}${RESET}"
[ -n "$GIT_INFO" ] && LINE1="${LINE1} ${COMMENT}(${RESET}${GRAY}${GIT_INFO}${RESET}${COMMENT})${RESET}"
LINE1="${LINE1} ${GREEN}+${ADDED}${RESET} ${RED}-${REMOVED}${RESET}"
echo -e "$LINE1"

# Line 2: [model] [context bar + %] [icon] [session duration]
echo -e "${GRAY}${MODEL}${RESET} ${BAR} ${GRAY}${PCT}%${RESET} ${COMMENT}·${RESET} ${GRAY}${ICON_CLOCK} ${DURATION}${RESET}"

# Line 3 visibility: CLAUDE_STATUSLINE_LIMITS = auto (default) | always | never.
# "auto" hides the limits when this session runs inside tmux AND tmux-vitals' Claude segment is
# already in the tmux status bar (the same numbers would be shown twice, one line apart).
LIMITS_MODE="${CLAUDE_STATUSLINE_LIMITS:-auto}"
show_limits() {
  case "$LIMITS_MODE" in
    always) return 0 ;;
    never)  return 1 ;;
  esac
  [ -z "$TMUX" ] && return 0
  # show-options takes one option per call
  ! { tmux show -g status-format; tmux show -g status-left; tmux show -g status-right; } 2>/dev/null \
    | grep -q 'vitals_claude\|vitals.sh claude\|vitals_llm\|vitals.sh llm'
}

# Line 3: same layout as tmux-vitals' segment_claude/render_provider (scripts/helpers.sh:219-255,
# scripts/vitals.sh:257-259), minus the leading "✳ Claude" icon+label — 5h/7d usage with the
# same warn/crit thresholds and reset countdown via ICON_RESET. Falls back to the vitals
# no-cache placeholder ("—") when rate limits are absent from this session's payload.
if ! show_limits; then
  :
elif [ -n "$FIVE_HR" ] || [ -n "$SEVEN_DAY" ]; then
  LINE3=""
  if [ -n "$FIVE_HR" ]; then
    COLOR5="$(level_color "$FIVE_HR")"
    LINE3="${GRAY}5h${RESET} ${COLOR5}${FIVE_HR}%${RESET}"
    [ -n "$FIVE_HR_RESET" ] && LINE3="${LINE3} ${COMMENT}${ICON_RESET} $(until_epoch "$FIVE_HR_RESET")${RESET}"
  fi
  if [ -n "$SEVEN_DAY" ]; then
    COLOR7="$(level_color "$SEVEN_DAY")"
    if [ -n "$FIVE_HR" ]; then
      LINE3="${LINE3} ${COMMENT}·${RESET} ${GRAY}7d${RESET} ${COLOR7}${SEVEN_DAY}%${RESET}"
    else
      LINE3="${GRAY}7d${RESET} ${COLOR7}${SEVEN_DAY}%${RESET}"
    fi
    [ -n "$SEVEN_DAY_RESET" ] && LINE3="${LINE3} ${COMMENT}${ICON_RESET} $(until_epoch "$SEVEN_DAY_RESET")${RESET}"
  fi
  echo -e "$LINE3"
else
  echo -e "${DIM}—${RESET}"
fi

More status lines

Opus 4.8 [high] ~/app main 16:20:55 | ⛁ ██░░░░░░░░ 22% | 5h ●◔○○○ 26% ↻2h7m | 7d ◔○○○○○○ 7% ↻2d1h │ $0.41 ⏱ 10m

Activity Feed

51 copies

Opus 4.8 high ✦ │ ctx 22% │ app (main) │ PR #1287 ● │ $0.41 · 10m +128 -34 Session ● ● ● ● ● ● ● ● ○ ○ ○ 74% left Resets in 2h 6m Weekly ● ● ● ● ● ● ● ● ● ● ○ 93% left Resets in 2d 0h Fable ● ● ● ● ● ● ● ● ● ○ ○ 85% left Resets in 2d 0h ◐ Read:index.ts ✓ Read×1 ✓ Bash×1 ✓ Edit×1 ✓ Grep×1 ◐ code-reviewer Review the change for regressions
Opus 4.8 │ ✍️ 22% │ app (main) │ ● high current ●●○○○○○○○○ 26% ⟳ 6:59pm weekly ○○○○○○○○○○ 7% ⟳ aug 1, 5:52pm
Model: Opus 4.8 | Thinking: high | Context: [▰▰▱▱▱▱▱▱▱▱] 45k/200k (22%) | cwd: ~/app | ⎇ main | (+0,-0) Cost: $0.41 | Block: 2hr 6m | Weekly: 7.0% | Session: 10m | In: 916.7 t/s | Out: 29.2 t/s | Cached: 2k | Session: [▰▱▱▱▱] 26.0% Mem: 0.8G/1.0G | (*゚∀゚*) | Session ID: b8e1c0d2-4a6f-4e2a-9c1b-3f5d7a9e2c10

Kanji Rain

7 copies

庫 app · 枝 main · 脳 OPUS-4.8 文 ▓▓░░░░░░ 22% · 時 ▓▓░░┃░░░ 26% · 週 ▓░░░░┃░░ 7%

Pace Arrows

5 copies

Opus 4.8 (200K) high | app (main) ██░░░░░░░░ 22% 200K | 5h 26% ⇣32% 2h 7d 7% ⇣63% 2d

Related mods

Terminal

❯ /deck demo ⎿ deck: Sample plan running above the prompt, with sample routing until real ones arrive. [-] 0: deck ▾ · 5 rows 22:11:41 ⇄ Model route opus = opus jev: haiku · not applied effort ▁▃·· medi = kept ✕ ✓ Orders module Done · 12/12 · 2/2 agents 100% ✕ ● Context 44k / 200k 22% ✕ ◔ Session · 5h 5h · 26% used ↻ 2:04:24 ✕ ◔ Weekly · 7d 7d · 7% used ↻ 2d 0h 57m ✕ ❯  ⏵⏵ auto mode on (shift+tab to cycle) · ← for agents [ Deck 1 ]

Claude Desktop
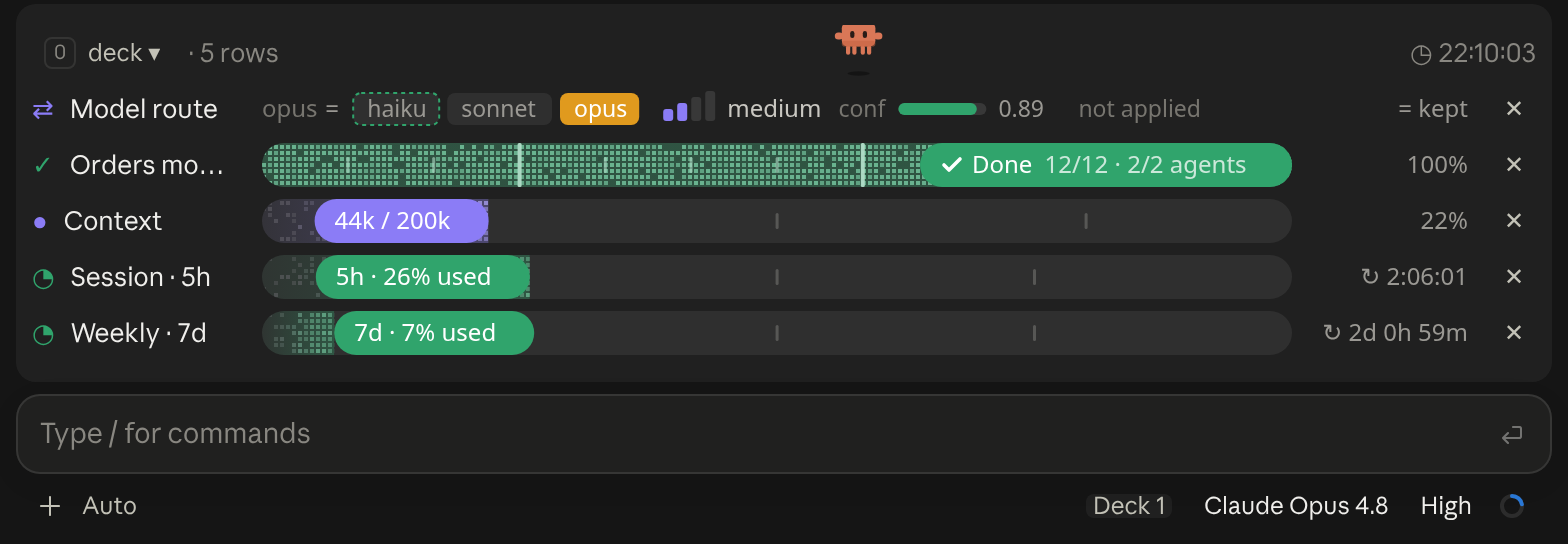
Deck in Claude Desktop

A cockpit for Claude Code: plan bars and subagent strips, context, usage limits with reset countdowns and burn rates, spend, the model route and a pet. Six bar styles, three collapsed looks. CLI and Desktop.

Terminal

[-] zZ ▀▄ ▄▀ ▄▄▀▀▀▀▀▀▀▀▀▀ ▀▀▀▄▄▄ ▀▀▀▀▀▀▀▀▀▀▀▀ ▀▀▀▀▀▀▀▀ ctx 22% [ Pet ♥ ] [ ⚙ ] [ ↻ Adventurer ] [ Hide ] ❯ 

Claude Desktop

Pixel Cat in Claude Desktop

A little pixel cat that wanders above the Claude Code prompt, watches your usage limits and announces when work finishes; or switch packs for an adventurer who mines, chops trees and fights zombies

Terminal

╭─────────────────────────────────────────────────────────────────────────────────────────────╮ [-] │ ◆ context 44k of 200k · compacts at 167k 22% │ │ ████████████████████────────────────────────────────────────────────────────░░░░░░░░░░░░░░░ │ │ ■ system prompt 1.9k 1% ■ system tools 28k 14% ■ skills 2k 1% ■ messages 12k 6% │ │ ─ free space 123k ░ autocompact buffer 33k │ ╰─────────────────────────────────────────────────────────────────────────────────────────────╯ ❯ 

Claude Desktop

Context Bar in Claude Desktop

Your context window as a stacked bar above the prompt, a color per category, with token counts and the compaction point. /context-bar shows or hides it.

Terminal

BURN ▁ ▂ *▂▆ ▃ $0.41 = 0.04 burritos [-] 5h 26% in 2h 5m ▅▄█▅▅▆█▆███▅█ opus 4.8 44k in 1k out wk 7% in 2d 0h █████████████░░░░░░░░░░░░░░░░░░░░░░░░░░░░░░░░░░░░ lifetime $0.41 hide ❯ 

Claude Desktop

Burn Meter in Claude Desktop

Live session cost odometer above the prompt: a burning fuse, real-world comparisons, threshold alerts