Burn Meter

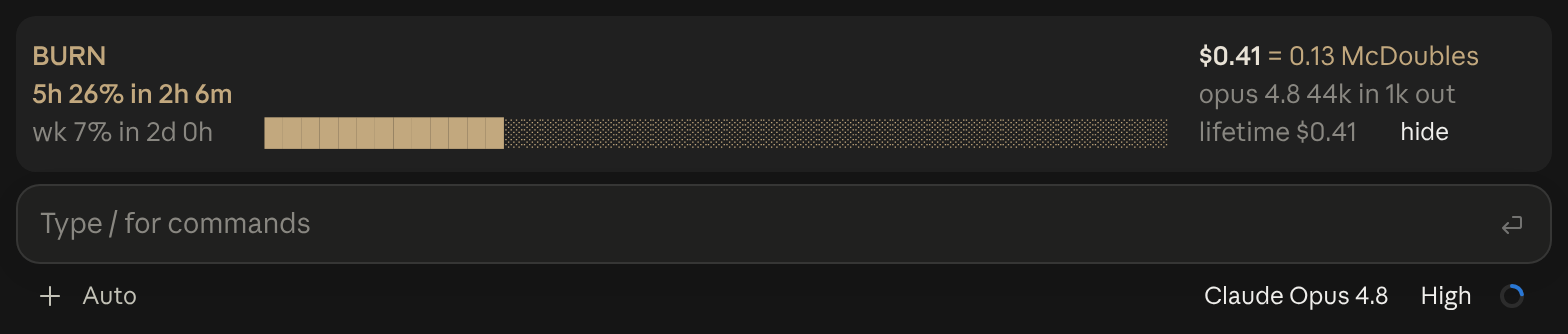
Live session cost odometer above the prompt: a burning fuse, real-world comparisons, threshold alerts
0 copies
Or run it yourself:
claude plugin marketplace add https://statuslin.es/marketplace.json
claude plugin install burn-meter@statuslines
Preview
Terminal
BURN               ▁   ▂ *▂▆ ▃                                      $0.41 = 0.04 burritos       [-]
5h 26% in 2h 5m  ▅▄█▅▅▆█▆███▅█                                      opus 4.8 44k in 1k out
wk 7% in 2d 0h   █████████████░░░░░░░░░░░░░░░░░░░░░░░░░░░░░░░░░░░░  lifetime $0.41  hide
❯
Claude Desktop
More like this
Terminal
                                                                                                [-]
                                                                                    zZ
                                                                            ▀▄   ▄▀
                                                                        ▄▄▀▀▀▀▀▀▀▀▀▀       ▀▀▀▄▄▄
                                                                        ▀▀▀▀▀▀▀▀▀▀▀▀      ▀▀▀▀▀▀▀▀
 ctx 22%                                             [ Pet ♥ ] [ ⚙ ] [ ↻ Adventurer ] [ Hide ]
❯
Claude Desktop

A little pixel cat that wanders above the Claude Code prompt, watches your usage limits and announces when work finishes; or switch packs for an adventurer who mines, chops trees and fights zombies

Terminal
╭─────────────────────────────────────────────────────────────────────────────────────────────╮ [-]
│ ◆ context                                              44k of 200k · compacts at 167k  22%  │
│ ████████████████████────────────────────────────────────────────────────────░░░░░░░░░░░░░░░ │
│ ■ system prompt 1.9k 1%   ■ system tools 28k 14%   ■ skills 2k 1%   ■ messages 12k 6%       │
│ ─ free space 123k   ░ autocompact buffer 33k                                                │
╰─────────────────────────────────────────────────────────────────────────────────────────────╯
❯
Claude Desktop

Your context window as a stacked bar above the prompt, a color per category, with token counts and the compaction point. /context-bar shows or hides it.

Opus 4.8 [high] ~/app main
16:20:55 | ⛁ ██░░░░░░░░ 22% | 5h ●◔○○○ 26% ↻2h7m | 7d ◔○○○○○○ 7% ↻2d1h │ $0.41 ⏱ 10m
Two-line status with a block context bar and quarter-step dot meters (◔◑◕●) for the 5-hour and weekly limits (fill shows usage, color shows whether you are ahead of or behind pace), plus model, effort, git and cost. Needs no jq.

  Opus 4.8 high ✦ │ ctx 22% │ app (main) │ PR #1287 ● │ $0.41 · 10m +128 -34
  Session ● ● ● ● ● ● ● ● ○ ○ ○  74% left  Resets in 2h 6m
  Weekly  ● ● ● ● ● ● ● ● ● ● ○  93% left  Resets in 2d 0h
  Fable   ● ● ● ● ● ● ● ● ● ○ ○  85% left  Resets in 2d 0h
  ◐ Read:index.ts  ✓ Read×1  ✓ Bash×1  ✓ Edit×1  ✓ Grep×1
  ◐ code-reviewer Review the change for regressions
A header with model, context and burn rate per hour, then live tool and agent activity parsed from the session transcript.

Model: Opus 4.8 | Thinking: high | Context: [▰▰▱▱▱▱▱▱▱▱] 45k/200k (22%) | cwd: ~/app | ⎇ main | (+0,-0)
Cost: $0.41 | Block: 2hr 6m | Weekly: 7.0% | Session: 10m | In: 916.7 t/s | Out: 29.2 t/s | Cached: 2k | Session: [▰▱▱▱▱] 26.0%
Mem: 0.8G/1.0G | (*゚∀゚*) | Session ID: b8e1c0d2-4a6f-4e2a-9c1b-3f5d7a9e2c10
Three lines in One Dark: model, thinking effort and a context bar up top; cost, quota, session clock and token throughput in the middle; weather, free memory and a rotating kaomoji below.

Opus 4.8 (200K) high                    |  app (main)
██░░░░░░░░ 22% 200K |  5h 26% ⇣32% 2h  7d 7% ⇣63% 2d
Are you burning quota faster than the clock? Five-hour and seven-day usage with over- and under-pace arrows, plus a context bar and git diff stats. Reads rate limits from stdin only.
