One line above the prompt: context tokens with their weather, a bar per recent prompt, your 5-hour and 7-day limits against the time elapsed, the prompt cache with its time left, the session cost with the last prompt's share in dollars and in points of the 5-hour limit, and the subagents running. Labels in English, French or Russian. After Token Weather (Anthropic, Apache-2.0) and the ideas of usage-meter (HolyGrail) and prompt-cache-control (Daniel San).
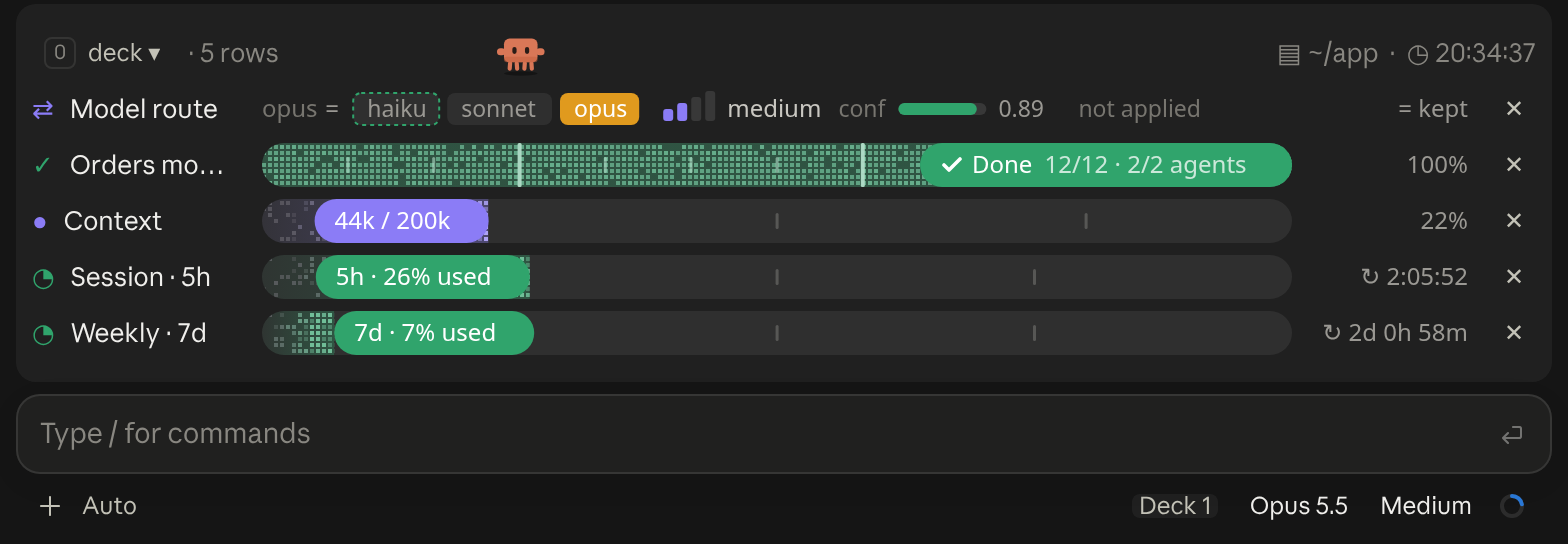
A cockpit for Claude Code: plan bars and subagent strips, context, usage limits with reset countdowns and burn rates, spend, the model route and a pet. Six bar styles, three collapsed looks. CLI and Desktop.
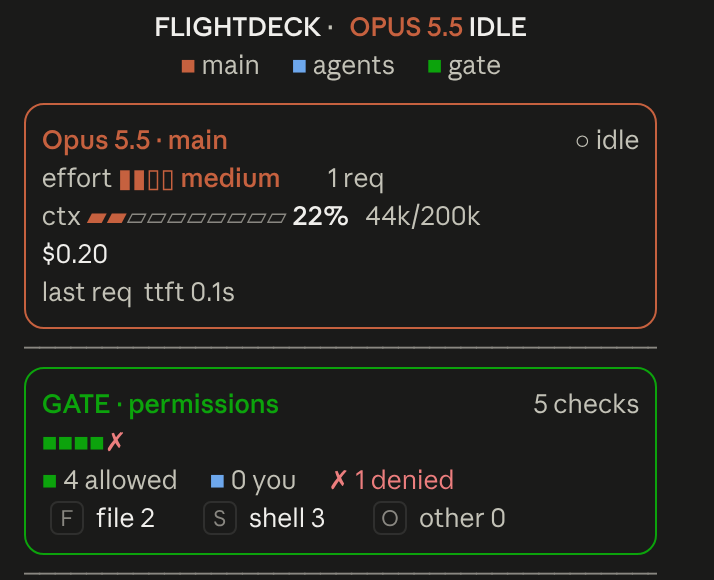
Flightdeck: a live agent dashboard for Claude Code. Main model vitals, an on-call architect, every permission check, subagent cards and swimlanes, a turn receipt and a session log, all from real session events
                       ▀▄   ▄▀                                                                  [-]
                      ▀▀▀▀▀▀▀▀▀
                      ▀▀▀▀▀▀▀▀▀
                       ▀▀▀▀▀▀▀▄ ▄▀                                                         ▀▀▀▄▄▄
                        ▀▀▀▀▀▀▀▀                                                          ▀▀▀▀▀▀▀▀
 ctx 22%                                             [ Pet ♥ ] [ ⚙ ] [ ↻ Adventurer ] [ Hide ]
A little pixel cat that wanders above the Claude Code prompt, watches your usage limits and announces when work finishes; or switch packs for an adventurer who mines, chops trees and fights zombies
app · main · Opus-4.8 · effort high · ctx 22% · 5h 26% ↻2h6m · 7d 7% ↻2d0h
One-line status bar showing your directory, git branch (with a * when dirty), model, live effort level, context-window usage, and 5-hour/7-day rate-limit usage.
Opus 4.8 [high] ~/app main
16:20:55 | ⛁ ██░░░░░░░░ 22% | 5h ●◔○○○ 26% ↻2h7m | 7d ◔○○○○○○ 7% ↻2d1h │ $0.41 ⏱ 10m
Two-line status with a block context bar and quarter-step dot meters (◔◑◕●) for the 5-hour and weekly limits (fill shows usage, color shows whether you are ahead of or behind pace), plus model, effort, git and cost. Needs no jq.
████▊░░░░░░░░░░░░░░░░░ 22% of 200K · GOOD │ ↓ 44.0K ↑ 1.4K │ $0.41 │ ⏱ 10m 12s │ +128/-34 │ 5h 26% ↻2h06m │ 7d 7% ↻2d0h │ ◆ Opus 5.5 · main · 03:53
One-line adaptation of @kyleledbetter's Dreambase Panel: a context bar with status word, token/cost/duration/lines-changed stats, and model + git branch + clock, all on a single line in a terracotta Claude-brand palette.
  Opus 4.8 high ✦ │ ctx 22% │ app (main) │ PR #1287 ● │ $0.41 · 10m +128 -34
  Session ● ● ● ● ● ● ● ● ○ ○ ○  74% left  Resets in 2h 6m
  Weekly  ● ● ● ● ● ● ● ● ● ● ○  93% left  Resets in 2d 0h
  Fable   ● ● ● ● ● ● ● ● ● ○ ○  85% left  Resets in 2d 0h
  ◐ Read:index.ts  ✓ Read×1  ✓ Bash×1  ✓ Edit×1  ✓ Grep×1
  ◐ code-reviewer Review the change for regressions
A header with model, context and burn rate per hour, then live tool and agent activity parsed from the session transcript.